What causes Ruby memory bloat?

At Phusion we run a simple multithreaded HTTP proxy server written in Ruby (which serves our DEB and RPM packages). I’ve seen it consume 1.3 GB of memory. This is insane – the server is stateless and doesn’t do all that much!
Turns out I’m not alone in experiencing this issue. Ruby apps can use a lot of memory. But why? According to Heroku and Nate Berkopec, a large part of excessive memory usage is caused by memory fragmentation, and by memory overallocation.
Nate Berkopec concludes that there are two solutions:
- Either use a completely different memory allocator than the one in glibc – usually jemalloc, or:
- Set the magical environment variable
MALLOC_ARENA_MAX=2.
Both the problem description and the given solutions bug me. Something feels off: I’m not convinced that the problem description is entirely correct, or that those are the only solutions available. I’m also bugged by the fact that so many people treat jemalloc as a magical silver bulllet.
Magic is simply science that we don’t understand yet. So I set out on a research journey to find out the truth behind this matter. In this article I’ll cover:
- An introduction into memory allocation: how does it work?
- What is this “memory fragmentation” and “memory overallocation” that people speak of?
- What causes the high memory usage? Is the situation as people have described so far, or is there more? (hint: yes, and I’ll share my research results)
- Are there alternative solutions available? (hint: I found one)
Note: the contents of this article only applies to Linux, and only to multithreaded Ruby apps.
Table of contents
- Ruby memory allocation 101
- What is fragmentation?
- Is fragmentation at the Ruby heap pages level the cause of memory bloating?
- Investigating fragmentation at the memory allocator level
- A magic trick: trimming
- Conclusion
Ruby memory allocation 101
Memory allocation in Ruby involves three layers, ordered from high to low level:
- The Ruby interpreter, which manages Ruby objects.
- The operating system’s memory allocator library.
- The kernel.
Let’s go over each layer.
Ruby
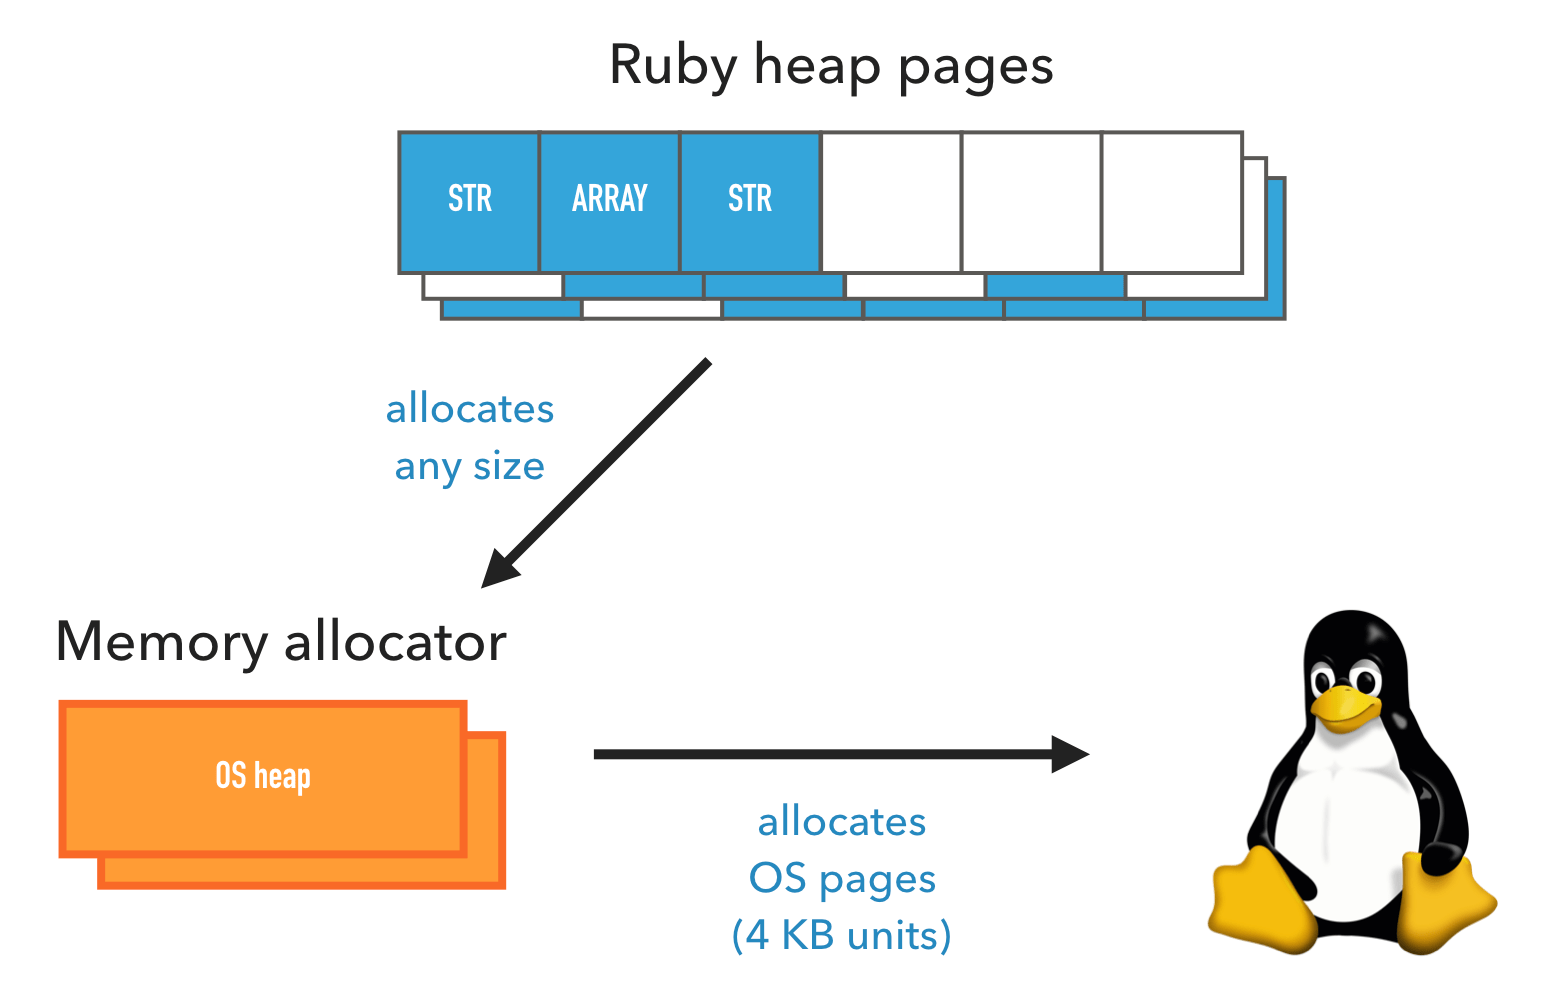
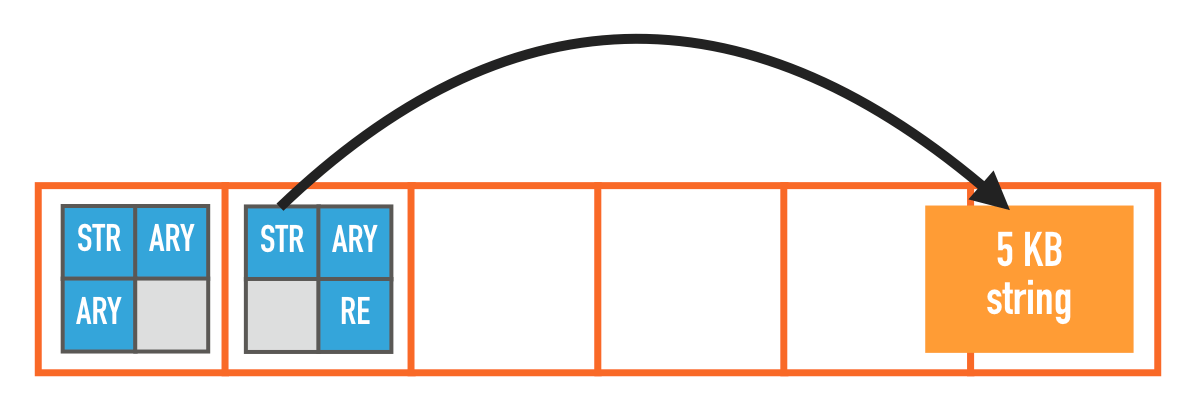
On the Ruby side, Ruby organizes objects in memory areas called Ruby heap pages. Such a Ruby heap page is split into equal-sized slots, where one object occupies one slot. Whether it’s a string, hash table, array, class, or whatever, it occupies one slot.
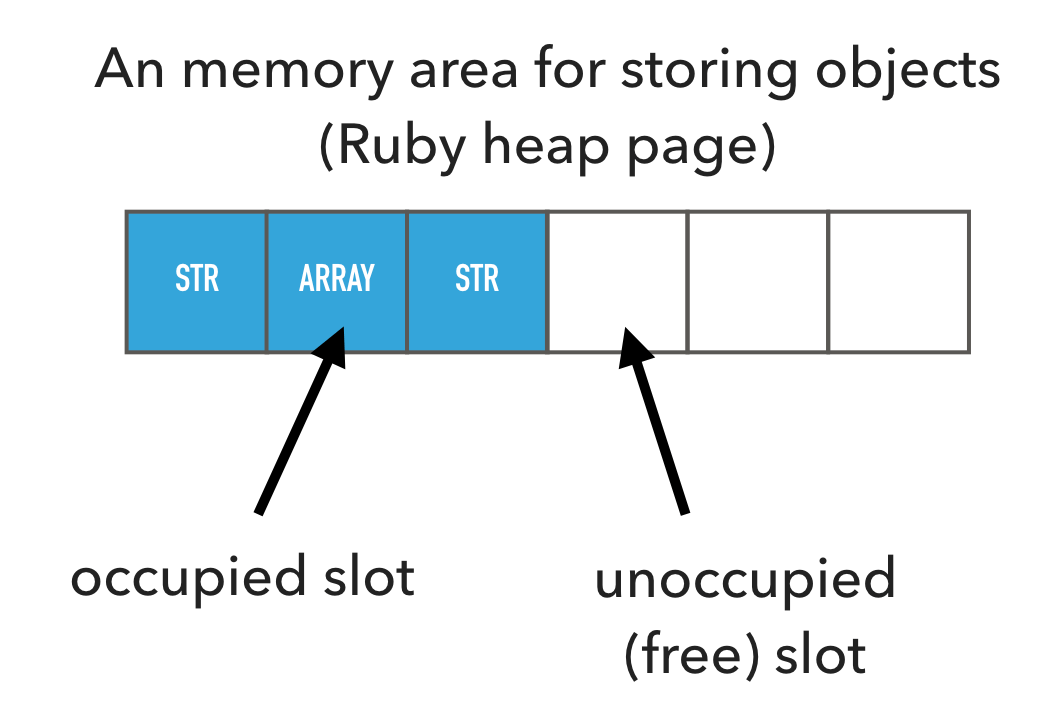
Slots in a Ruby heap page may either be occupied or free. When Ruby allocates a new object, it first tries to occupy a free slot. If there are no free slots, then it will allocate a new Ruby heap page.
A slot is small, about 40 bytes. Clearly not all Ruby objects fit in here – for example 1 MB strings. Ruby deals with this by storing any extraneous information – that doesn’t fit in the slot – in a different location outside the Ruby heap page. Ruby then places a pointer in the slot that allows it to find that external information.
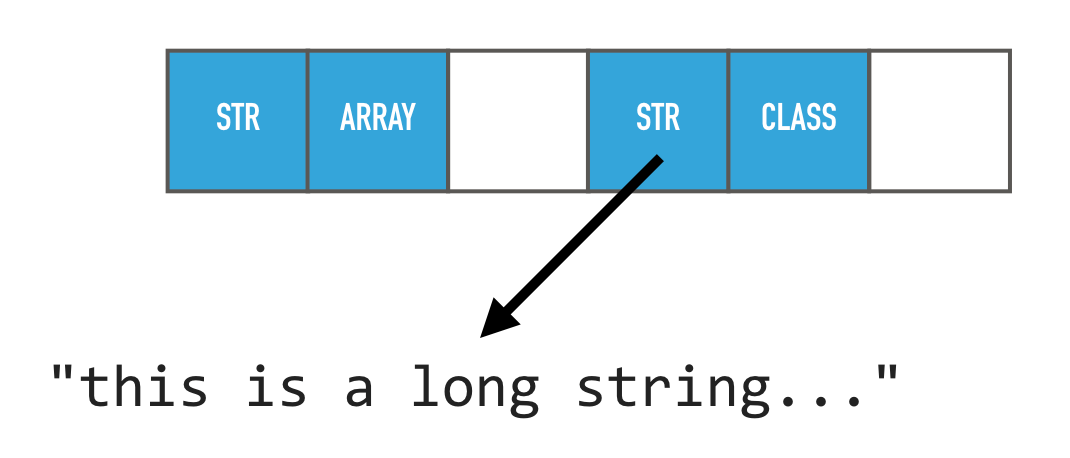
Both Ruby heap pages, and any external data, are allocated using the system’s memory allocator.
System memory allocator
The operating system’s memory allocator is a library that is part of glibc (the C runtime). It is used by nearly all apps, not just Ruby. It has a simple API:
- Memory is allocated by calling
malloc(size). You pass it the number of bytes you want to allocate, and it returns either the address of the allocation, or an error. - Allocated memory is freed by calling
free(address).
Unlike Ruby, which deals with equally-sized slots most of the time, the memory allocator has to deal with memory allocation requests of any size. As you will learn later, this fact introduces some complications.
The memory allocator, in turn, allocates memory through a kernel API. The memory allocator allocates much larger chunks of memory from the kernel than is requested by its own callers, because calling the kernel is expensive and because the kernel API has a limitation: it can only allocate memory in units of 4 KB.
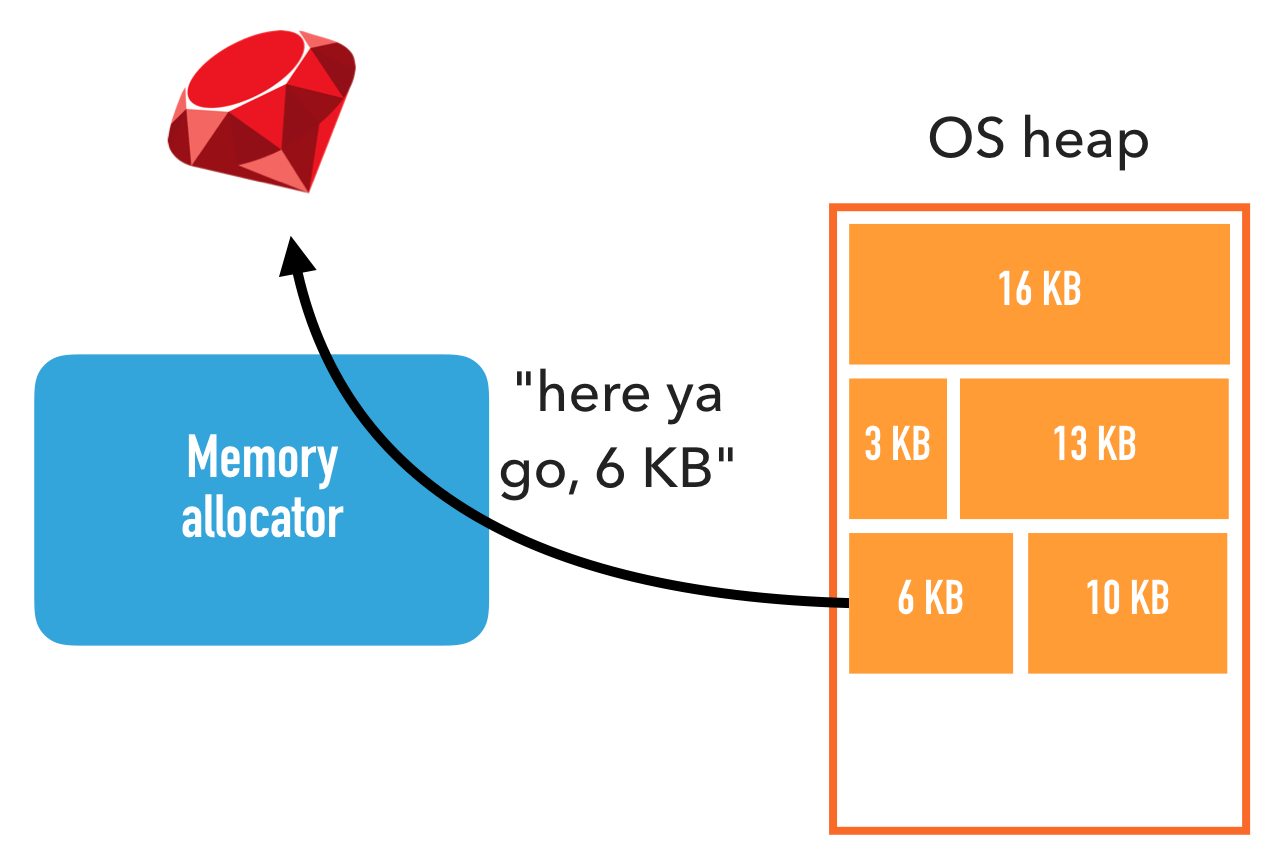
A memory area that the memory allocator allocates from the kernel, is called a heap. Note that this has got nothing to do with Ruby heap pages, so for clarity I will use the term OS heap.
The memory allocator then assigns pieces of an OS heap to its own callers, until there is no more free space, in which case the memory allocator allocates a new OS heap from the kernel. This is similar to how Ruby allocates objects from Ruby heap pages.
Kernel
The kernel can only allocate memory in units of 4 KB. One such 4 KB unit is called a page. Not to be confused with Ruby heap pages, which again have got nothing to do with this. So for clarity I will use the term OS page.
The reason for this is complicated, but suffice to say that all modern kernels have this property.
Allocating memory via the kernel also has a significant performance impact, so memory allocators try to minimize the number of kernel calls.
Defining memory usage
So memory is allocated at multiple levels, and each level allocates more memory than it actually needs. Ruby heap pages can have free slots, and OS heaps can have free spots. So when you ask the question “how much memory is used?” the answer depends entirely on at which level you ask the question!
When you use tools such as top or ps to measure a process’s memory usage, they tell you the memory usage from the kernel’s point of view. This means that layers above the kernel have to work in coordination in order to free memory from the kernel’s point of view. As you will learn next in the section about fragmentation, this could be harder than it seems.
What is fragmentation?
Memory fragmentation is the phenomenon that memory allocations are scattered all over the place, which can cause interesting problems.
Fragmentation at the Ruby level
Consider Ruby garbage collection. Garbage collecting an object means marking a Ruby heap page slot as free, allowing that slot to be reused. If an entire Ruby heap page ends up consisting only of free slots, then that entire Ruby heap page can be freed back to the memory allocator (and potentially back to the kernel).
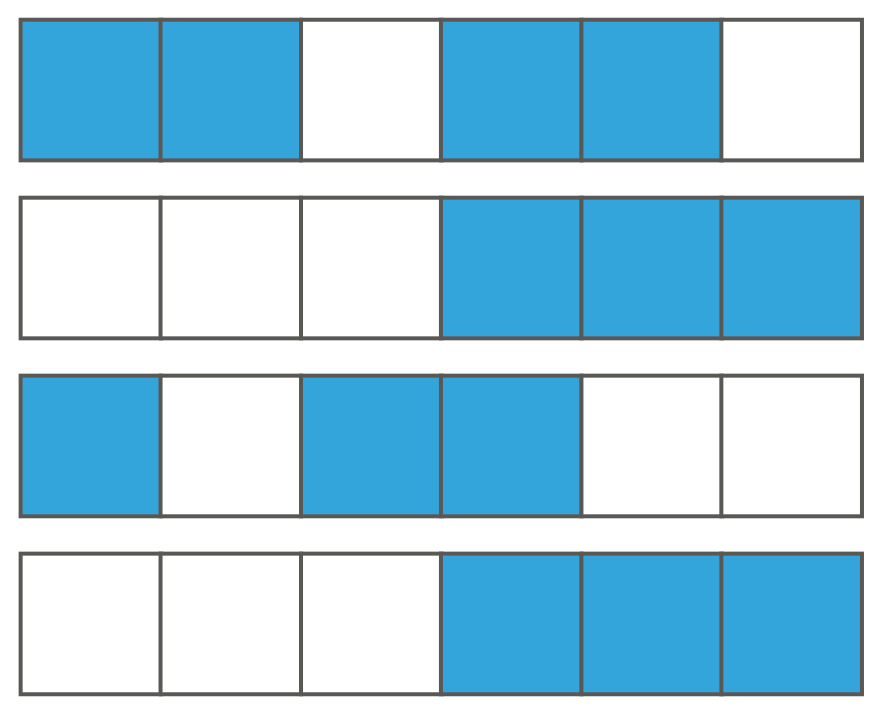
But what happens if not all slots are free? What if you have lots of Ruby heap pages, and a garbage collection frees up objects in different locations such that you end up with lots of free slots, but not many Ruby heap pages consist entirely of free slots? Even though there are free slots for Ruby to allocate objects into, as far as the memory allocator and the kernel are concerned, they’re still allocated memory!
Fragmentation at the memory allocator level
The memory allocator has a similar yet very different problem. The memory allocator doesn’t have to release entire OS heaps at once. In theory, it can release any individual OS page. But because the memory allocator has to deal with allocations of any size, an OS page can contain multiple allocations. It cannot release an OS page until all allocations within a released.
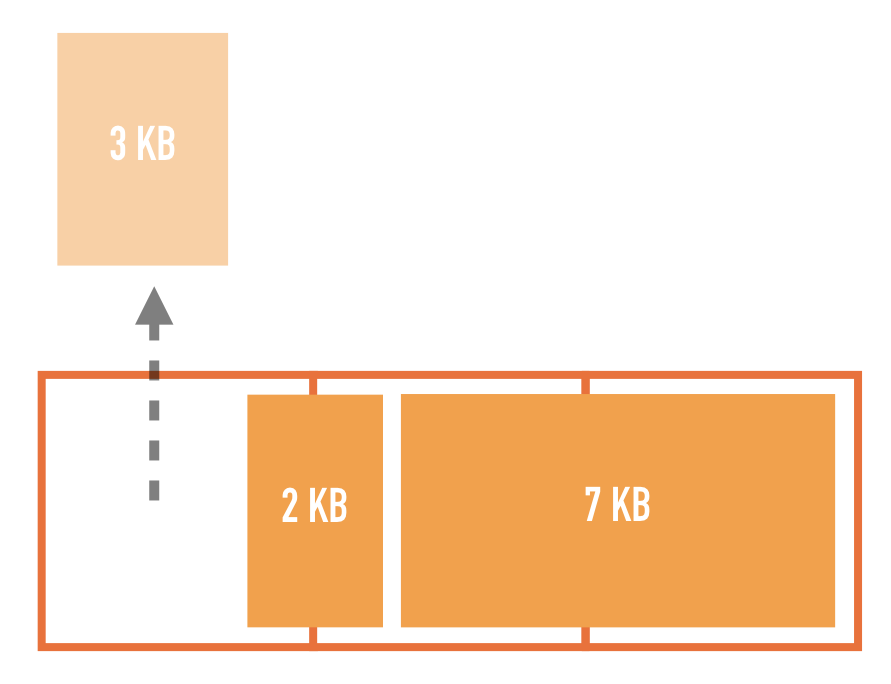
Consider what happens if there’s a 3 KB allocation and a 2 KB allocation, spread over 2 OS pages. If you free the 3 KB allocation then the first OS page is still partially occupied, and so it cannot be released.
So if we’re unlucky, then we can end up in a situation where there’s lots of free space inside OS heaps, but not many OS pages that are entirely free.
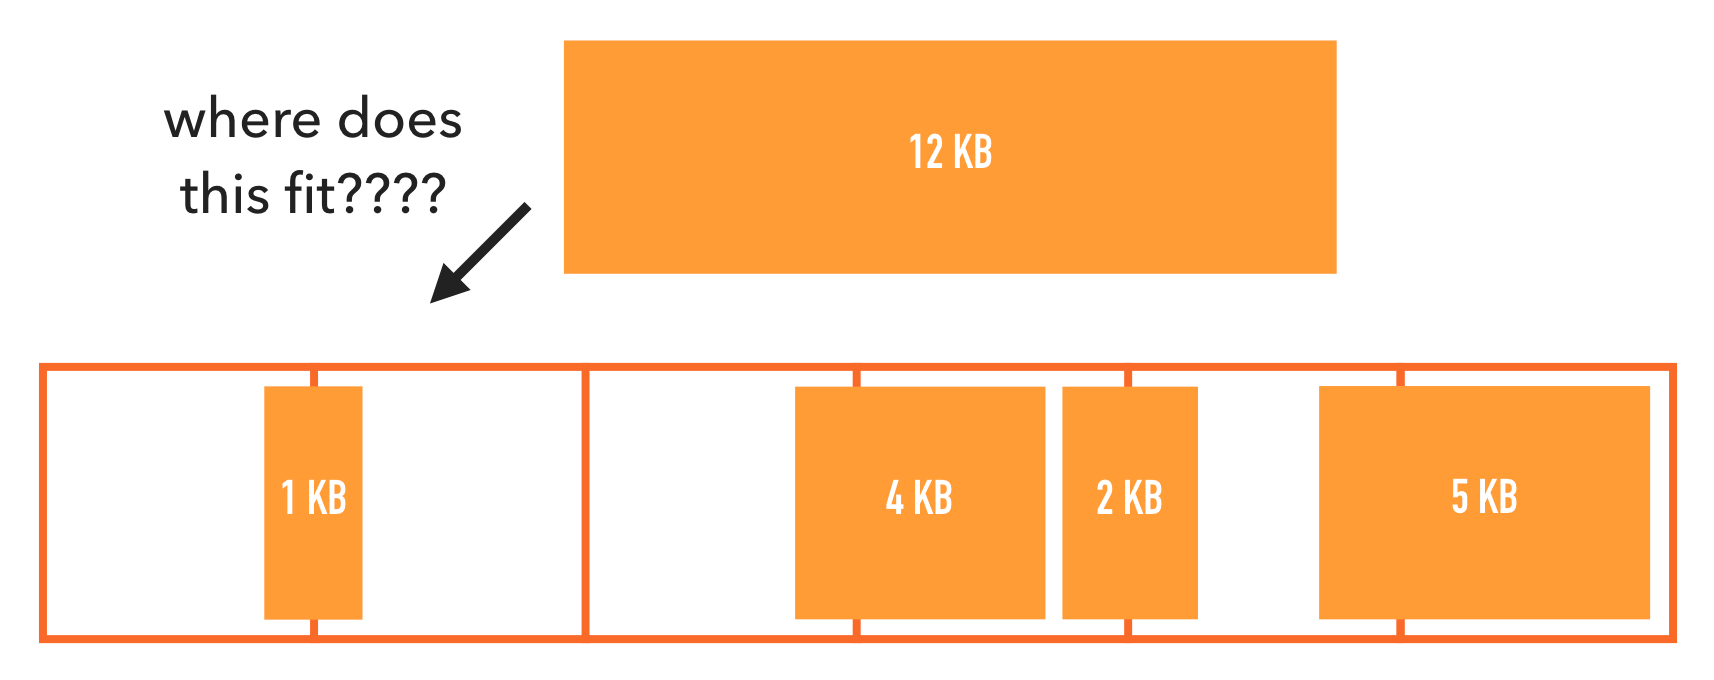
Worse. What if there are many holes, but none of them big enough to satisfy a new allocation request? The memory allocator will have to allocate an entirely new OS heap.
Is fragmentation at the Ruby heap pages level the cause of memory bloating?
It is plausible that fragmentation is what causes Ruby high memory usage. Assuming that fragmentation really is the cause, which of the two sources of fragmentation is the biggest contributor to memory usage? Is it…
- Ruby heap pages fragmentation? Or:
- Memory allocator fragmentation?
There is a simple way to verify whether it is #1. Ruby provides two APIs, ObjectSpace.memsize_of_all and GC.stat. With the information returned by both, we can count all the memory that Ruby knows it has allocated from the memory allocator.
ObjectSpace.memsize_of_all returns the memory occupied by all live Ruby objects. That is, the space taken up by its slot as well as any external data. In the above graphic, that’s the size of all blue and orange objects together.
GC.stat allows us to find out the size of all free slots, i.e. all the gray area in the above graph. Here’s the algorithm:
GC.stat[:heap_free_slots] * GC::INTERNAL_CONSTANTS[:RVALUE_SIZE]
If we sum them together, then that’s all the memory that Ruby knows it has allocated, and includes Ruby heap page fragmentation overhead. This means that if the process’s memory usage is higher than that, then the remaining memory usage comes from something that Ruby does not control, e.g. third-party libraries or fragmentation.
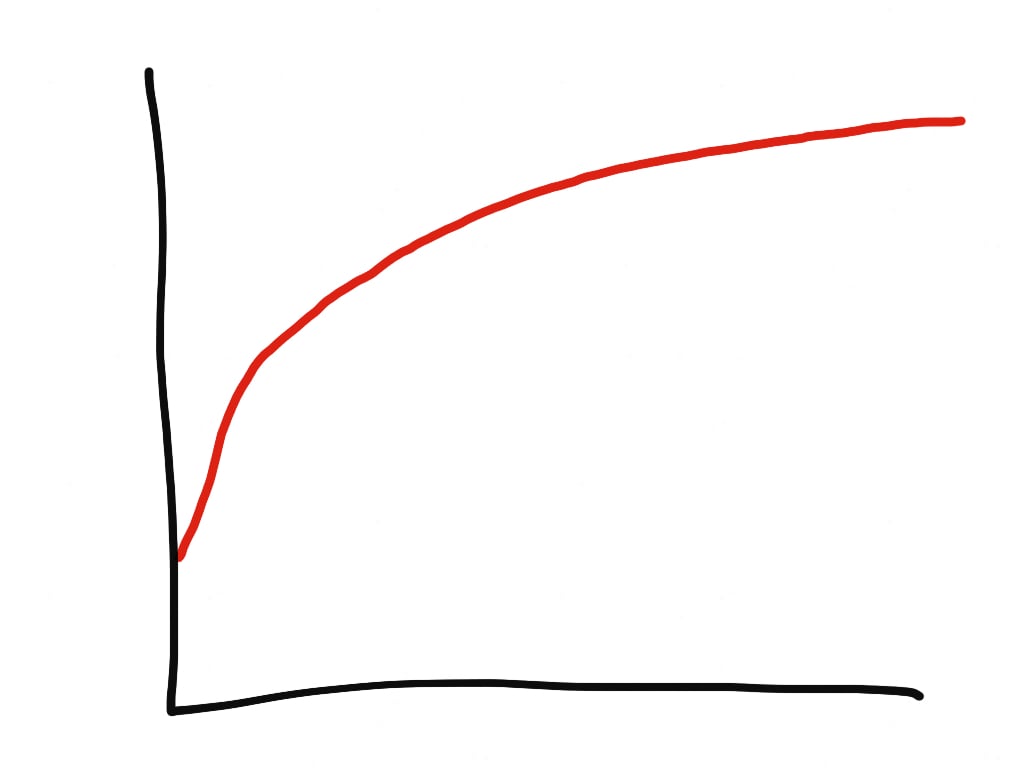
I wrote a simple test program that spawns a bunch of threads, each of which allocates strings in a loop. Here’s the memory usage that I measured after a while:
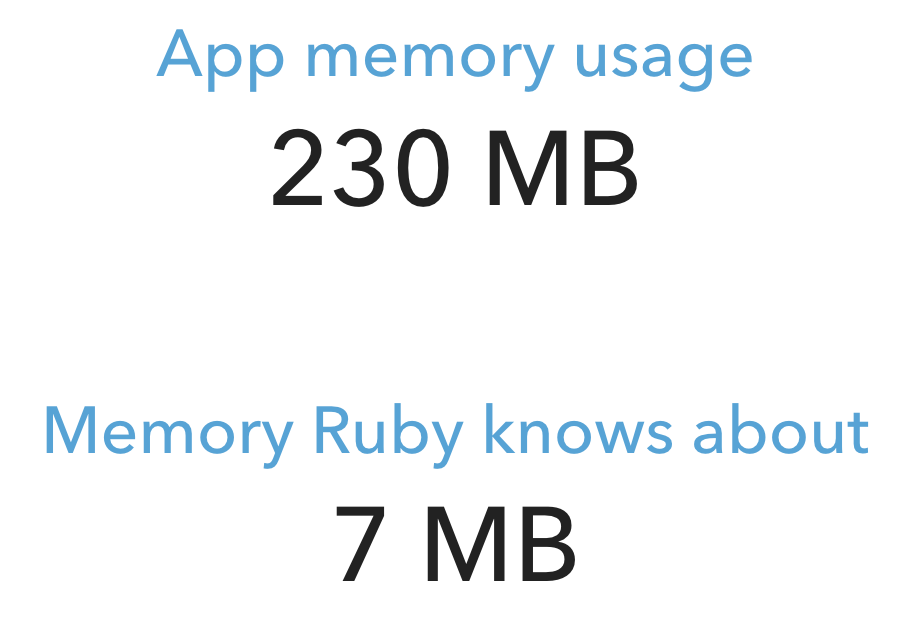
…this … is… insane!
This result shows us that Ruby’s own memory usage is such a small contributor to overall memory usage, that it doesn’t matter whether Ruby’s heap pages are fragmented or not.
We’ll have to look for the culprit elsewhere. At least now we know that it’s not Ruby’s fault.
Investigating fragmentation at the memory allocator level
Another likely suspect is the memory allocator. After all, Nate Berkopec and Heroku remarked that fiddling with the memory allocator (either replacing it altogether with jemalloc, or setting the magical environment variable MALLOC_ARENA_MAX=2) drastically lowers memory usage.
Let’s first take a look at what MALLOC_ARENA_MAX=2 does and why it helps. Next, we’ll investigate whether – and how much – there is fragmentation at the memory allocator level.
Overallocation & glibc memory arenas
The reason why MALLOC_ARENA_MAX=2 works has got to do with multithreading. When multiple threads try to allocate memory from the same OS heap at the same time, they contend for access. Only one thread can perform an allocation at a time, reducing multithreaded memory allocation performance.
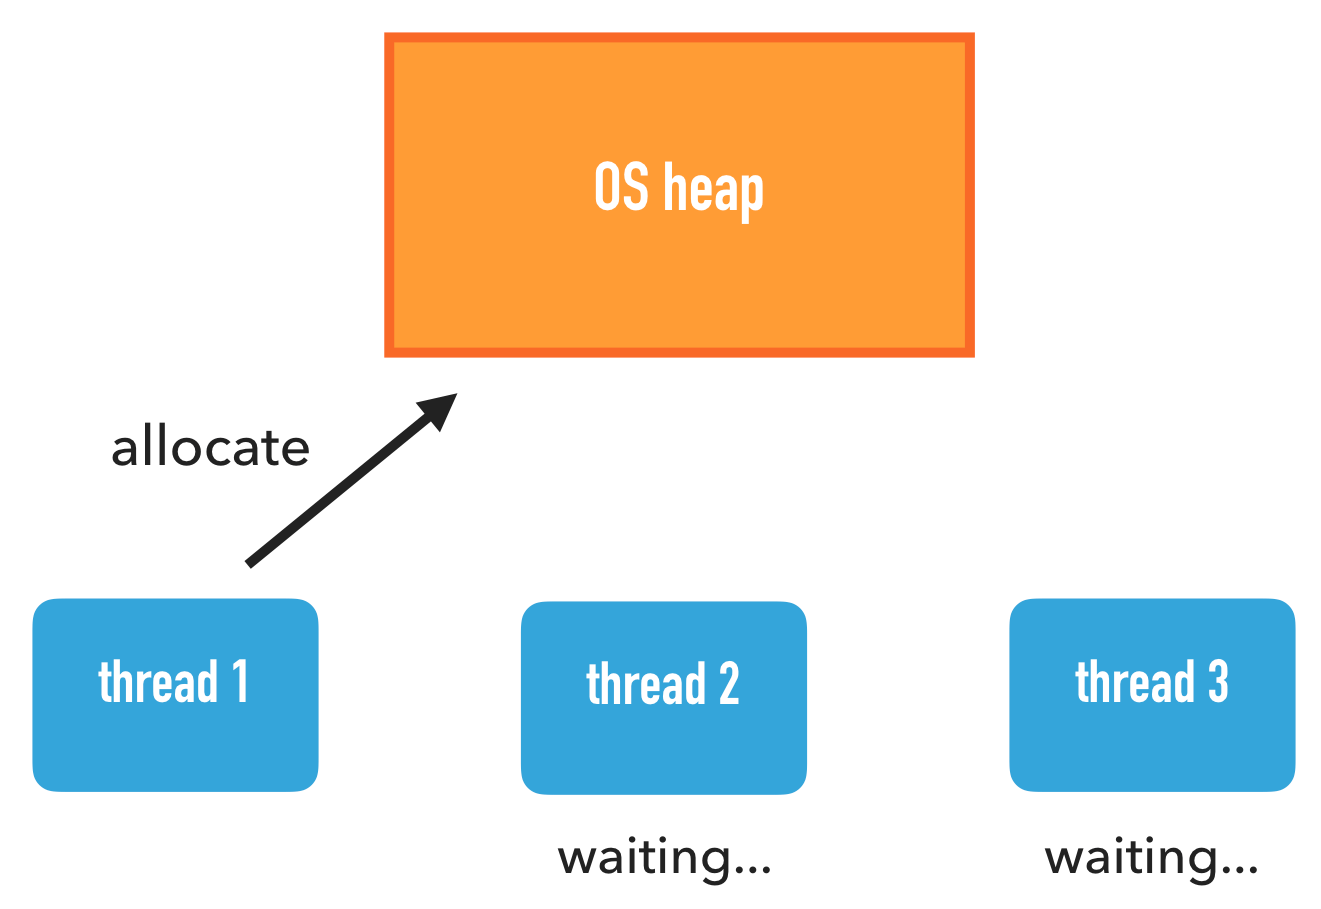
The memory allocator has an optimization for this scenario. It tries to create multiple OS heaps and tries to assign different threads to its own OS heap. Most of the time a thread only needs to work with that one, thereby avoiding contention with other threads.
In fact, the max number of OS heaps allocated in such a fashion is, by default, equal to 8 times the number of virtual CPUs. So on a 2-core system with 2 hyperthreads each, that’s 2 * 2 * 8 = 32 OS heaps! This is what I call overallocation.
Why is the default multiplier so big? It’s because the primary developer of the memory allocator is Red Hat. Their customers are enterprises who have machines with a ton of RAM. The above optimization allows improving average multithreading performance by 10% at the cost of huge memory usage. For Red Hat’s customers, this is the right tradeoff. For most non-enterprise users out there, not so much.
Nate’s blog post and the Heroku article state that more OS heaps equal more fragmentation, and cite the official documentation. The MALLOC_ARENA_MAX variable reduces the maximum number of OS heaps allocated for the purpose of reducing multithreading contention, and thus – so goes the logic – it reduces fragmentation.
Visualizing OS heaps
Are Nate’s and Heroku’s assertion that more OS heaps equals more fragmentation, correct? Actually, is fragmentation at the memory allocator level the problem at all? I wasn’t willing to take either assumptions for granted, so I started researching.
If only there is a way visualize the OS heaps so that I can see what’s going. Unfortunately there are no tools that allow me to do that.
So I wrote an OS heap visualizer myself.
First, I had to dump the layout of the OS heaps somehow. So I dived into the memory allocator source code to find out how the memory allocator internally lays out memory. Next, I wrote a library that traverses those data structures and writes the layout to a file. Finally, I wrote a tool that takes such a file as an input and compiles a visualization in the form of HTML and PNG images. Here is the source code.
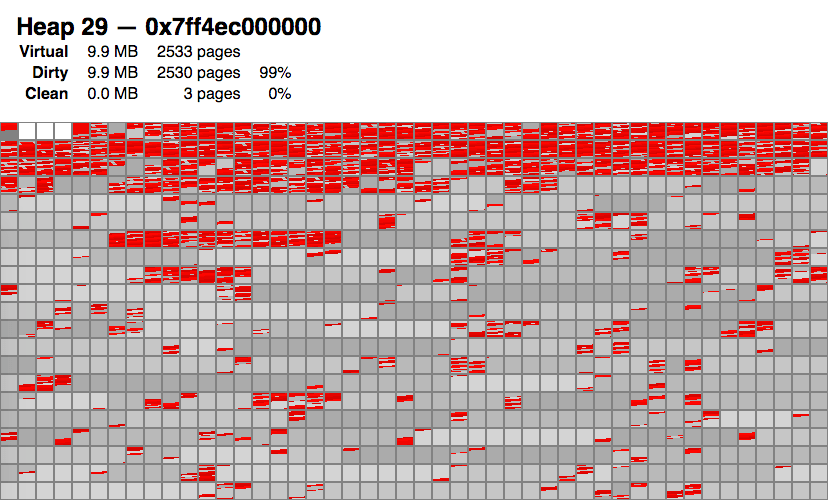
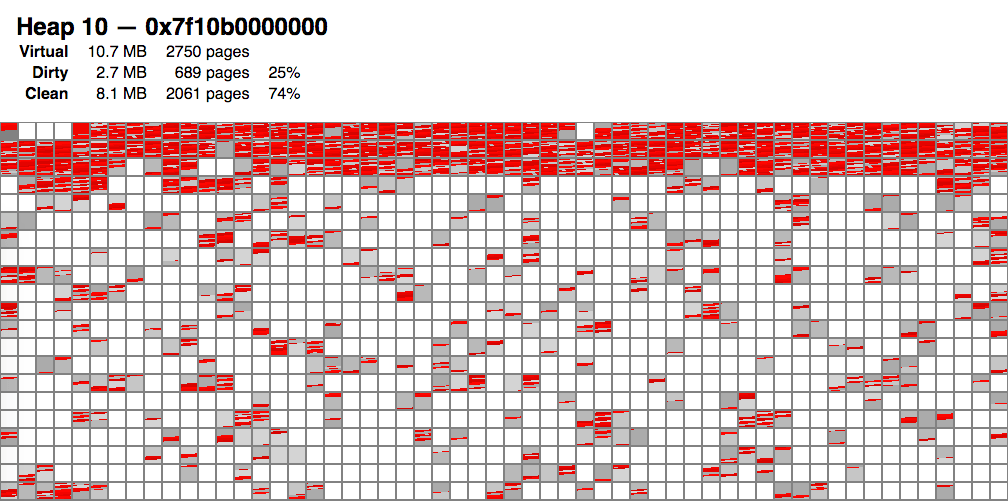
Here’s an example visualization of one particular OS heap (there are many more). The small blocks in this visualization represent OS pages.
- Red areas are memory locations in use.
- Gray areas are free locations, but not released back to the kernel.
- White areas are freed to the kernel.
I can deduce the following from the visualization:
- There is some fragmentation. Because the red spots are scattered, and some OS pages are only half red.
- To my surprise, most OS heaps look like this: there’s a significant number of entirely-gray OS pages without any red inside!
Then, it struck me:
Even though fragmentation could be an issue, it doesn't seem to be as bad as people thought!
Rather, the large amount of gray seems to be more problematic: that’s the memory allocator not releasing memory back to the kernel!
After researching the memory allocator’s source code more, it turns out that by default it only releases OS pages at the end of an OS heap, and even that is only done occassionally. This is probably done for performance reasons.
A magic trick: trimming
Luckily I found a magic trick. There is an API to force the memory allocator to free all eligible OS pages to the kernel, not just those at the end. It’s called malloc_trim.
I knew about this function but did not think it was useful, because of this sentence in its manual page:
The malloc_trim() function attempts to release free memory at the top of the heap.
The manual is wrong! Analysis of the source code tells me that it frees all eligible OS pages, not just those at the top.
So I thought, what happens if we modify Ruby to call this function during garbage collection? I patched Ruby 2.6 to call malloc_trim() in gc.c, function gc_start, like this:
gc_prof_timer_start(objspace);
{
    gc_marks(objspace, do_full_mark);
    // BEGIN MODIFICATION
    if (do_full_mark)
    {
        malloc_trim(0);
    }
    // END MODIFICATION
}
gc_prof_timer_stop(objspace);
And here are the test results:
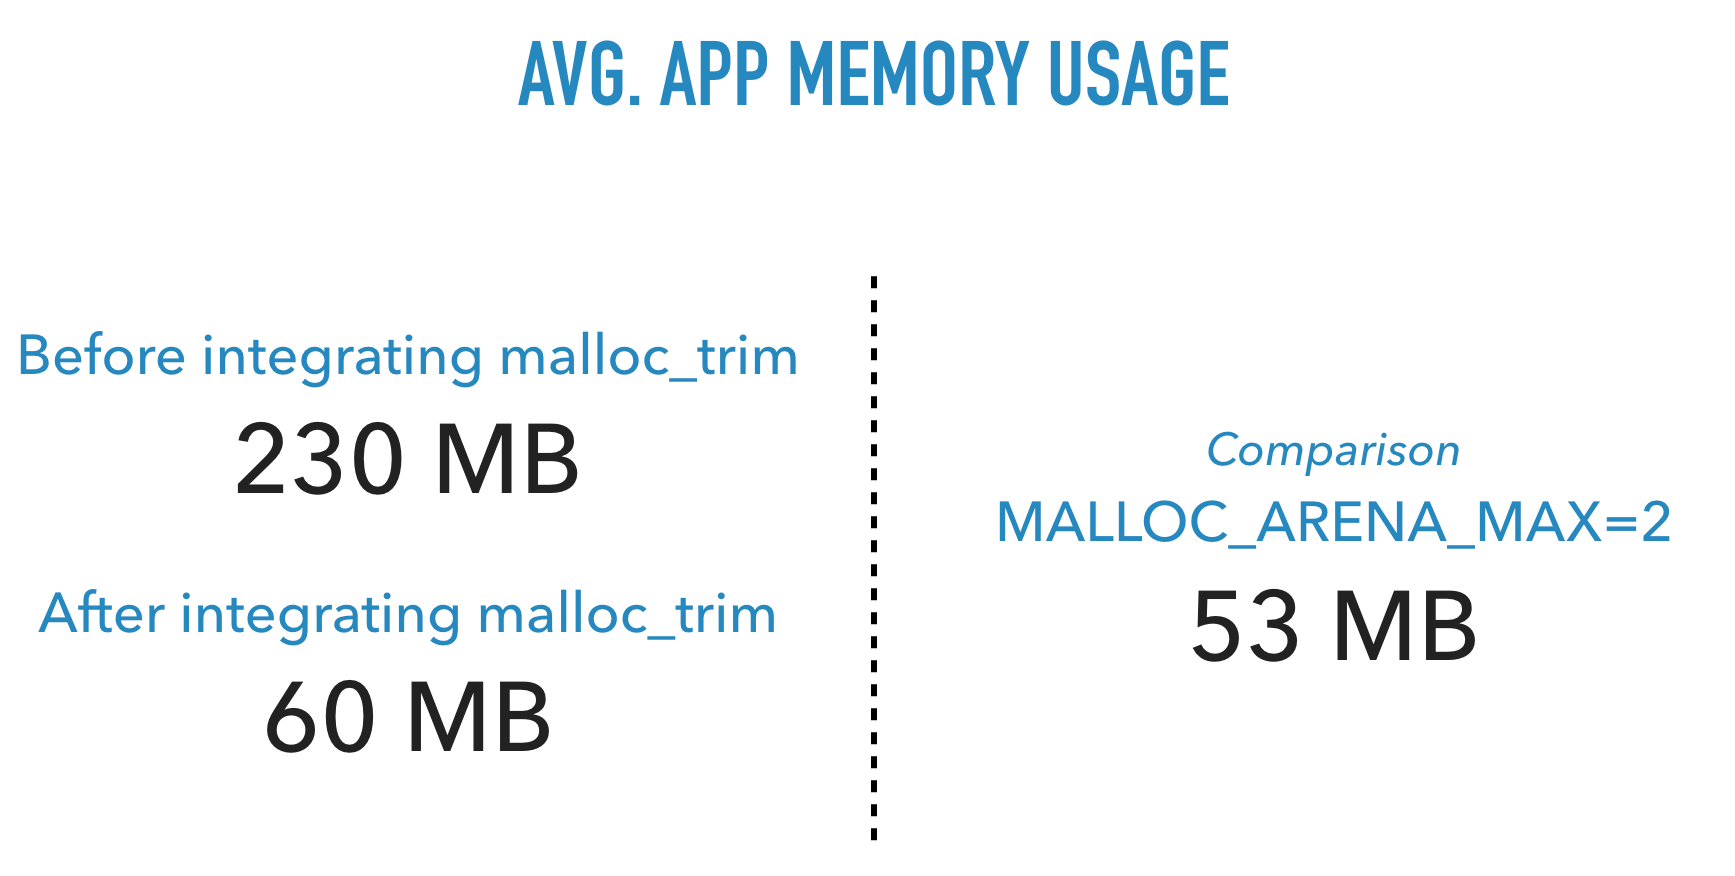
What a big difference! This simple patch causes memory usage to become almost as low as setting MALLOC_ARENA_MAX=2.
Here’s how things look like in the visualization:
We see a lot of “white holes”, which are OS pages freed back to the kernel.
Conclusion
Fragmentation turns out to be mostly a red herring. There’s still gains to be had by reducing fragmentation, but main problem is the fact that the memory allocator doesn’t like to free memory back to the kernel.
The solution turns out to be, fortunately, super simple. But finding the solution and the root cause… not so much.
Visualizer source code
Here is the OS heap visualizer source code.
What about performance?
One big concern was performance. Calling malloc_trim() can’t be free, and looking at the code the algorithm appears to run in linear time. So I reached out to Noah Gibbs, who ran the Rails Ruby Bench. To my surprise he found out that my patch yielded a slight performance increase.
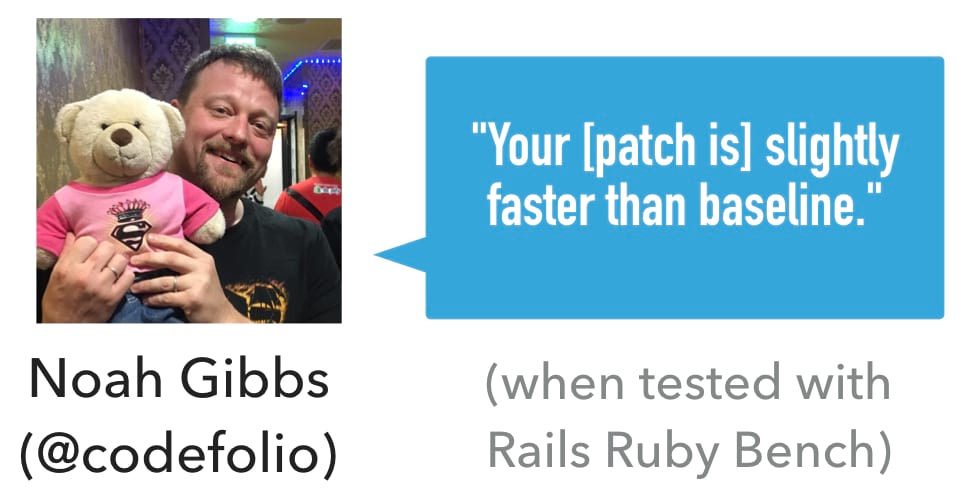

That blew my mind. I can’t explain it, but I’m not saying no to good news.
More testing needed
This research has only been tested against a limited number of cases, so I don’t know the impact on other workloads. If you would like to help with testing, please contact me.
Update 2019-03-29: I’ve written a follow-up in The status of Ruby memory trimming & how you can help with testing.