Netdata: simple server monitoring

I have been looking for an easy-to-use monitoring solution for Phusion’s servers. One that does not require a lot of setup and that provides a reasonable interface without too much work. Such a solution has to display a bunch of graphs at the very least. (Email) alerting is considered a bonus. The solution also has to be open source, not only because of the cost factor but because I want to own my data. So solutions like New Relic and Datadog are out.
In this blog post I will describe the solutions that I’ve checked out – Ganglia, Monit, Munin, Prometheus, Grafana – and why I didn’t like them. Then I will explain why I think Netdata is a good choice and review its pros and cons.
The old guard: Ganglia, Munin, Monit
Ganglia and Munin used to be the to-go solutions. But they are tedious to set up, and they look like this:
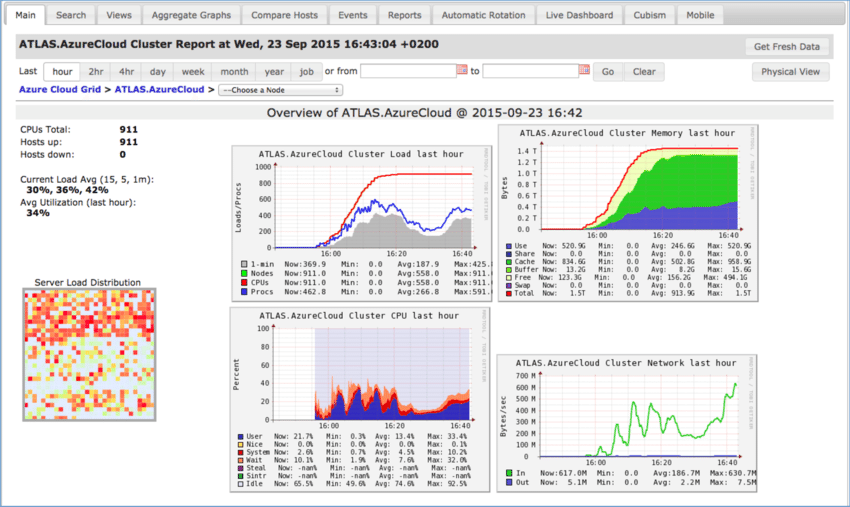
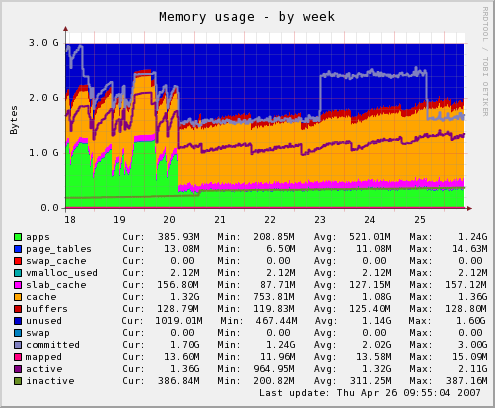
Yeah… no.
Monit also used to be a popular solution, but it does alerting only, no graphs.
Why I dismissed Prometheus and Grafana
More recently, Prometheus and Grafana seem to have become popular. However I find them to be too tedious to setup. I was looking for an all-in-one tool, so I was not pleased to find out that Prometheus is “just” a data collector and time series database, with hardly a good monitoring interface. This is what Prometheus looks like:
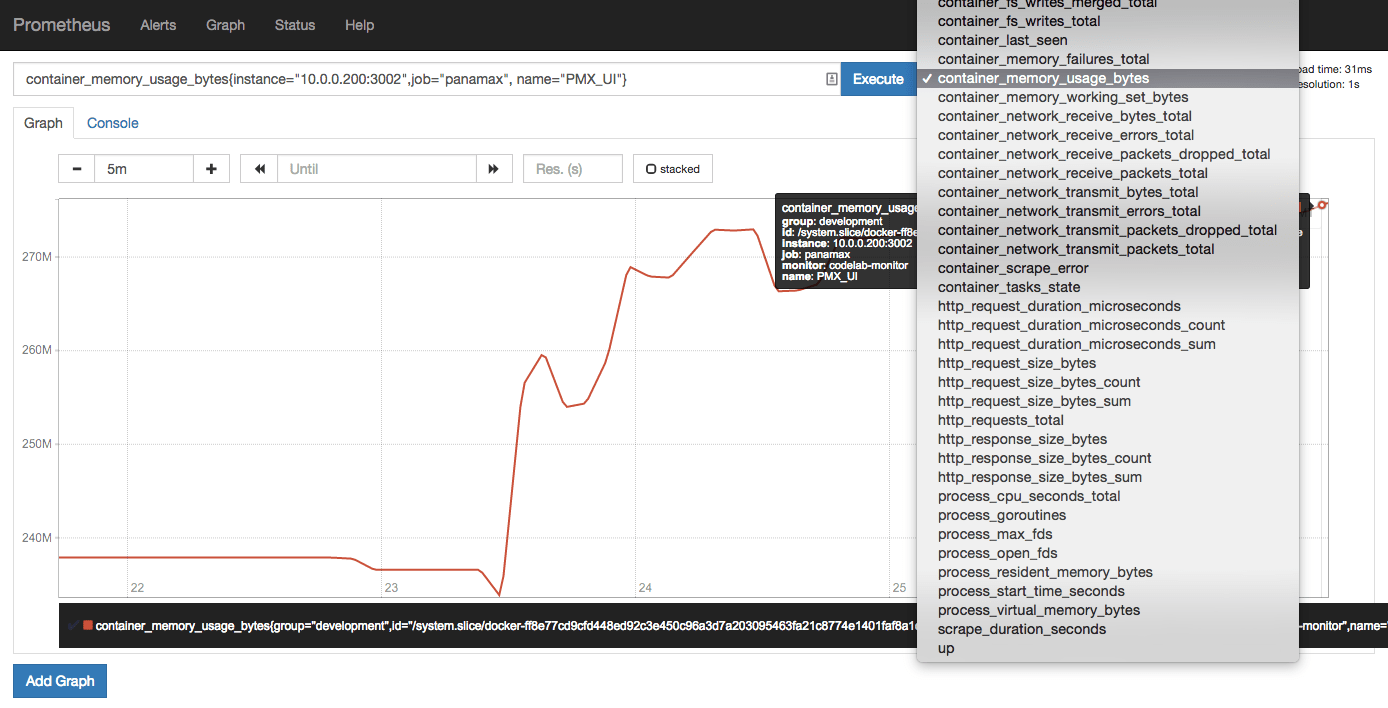
By default you don’t even see that one graph there. You have to enter a query string to specify what data in the time series database you want to query, and then it draws a graph. It does not save the queries for you so you have to re-enter your queries every time you to to the Prometheus dashboard.
This is why people combine Prometheus with Grafana to create a monitoring dashboard. Grafana is a graphing tool that can query data from many different sources. Grafana is not a data collection tool or time series database by itself, so you always need to combine Grafana with something else. Grafana persists your dashboard definitions.
When properly configured, Grafana can look like this:
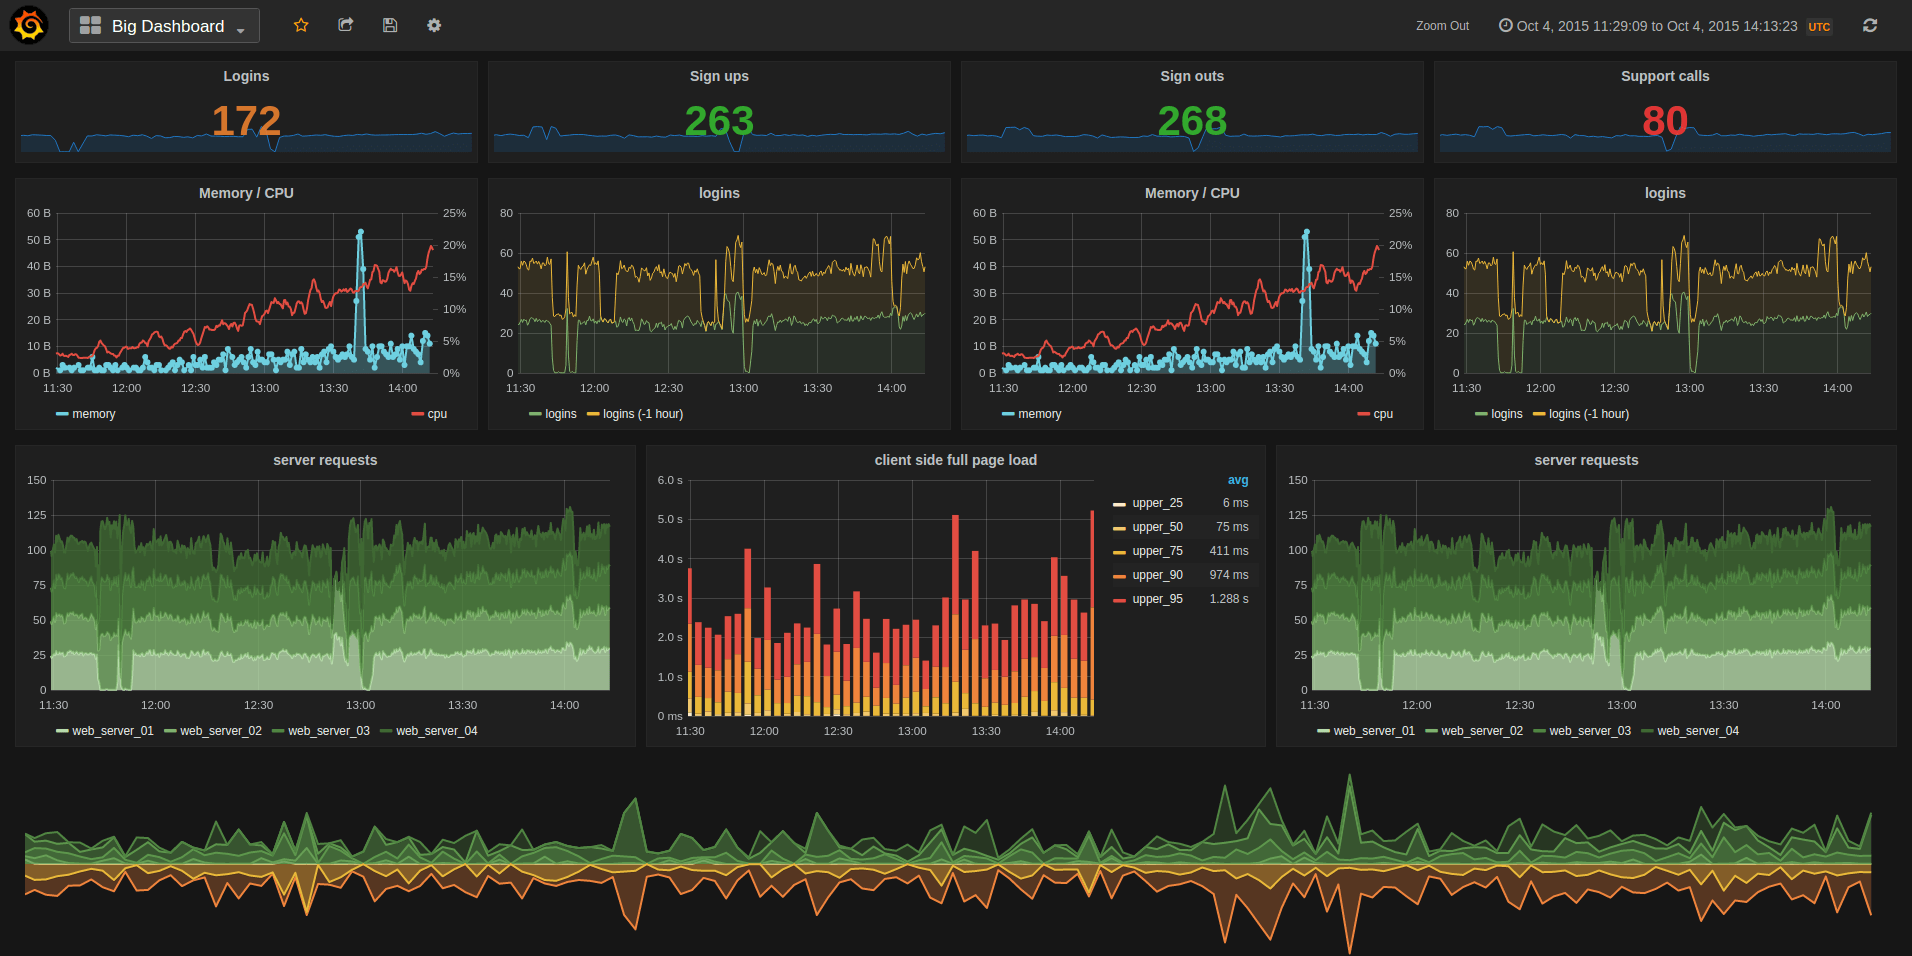
With emphasis on “properly configured”. To connect Prometheus to Grafana and to define your graphs, you have to go through interfaces like these:
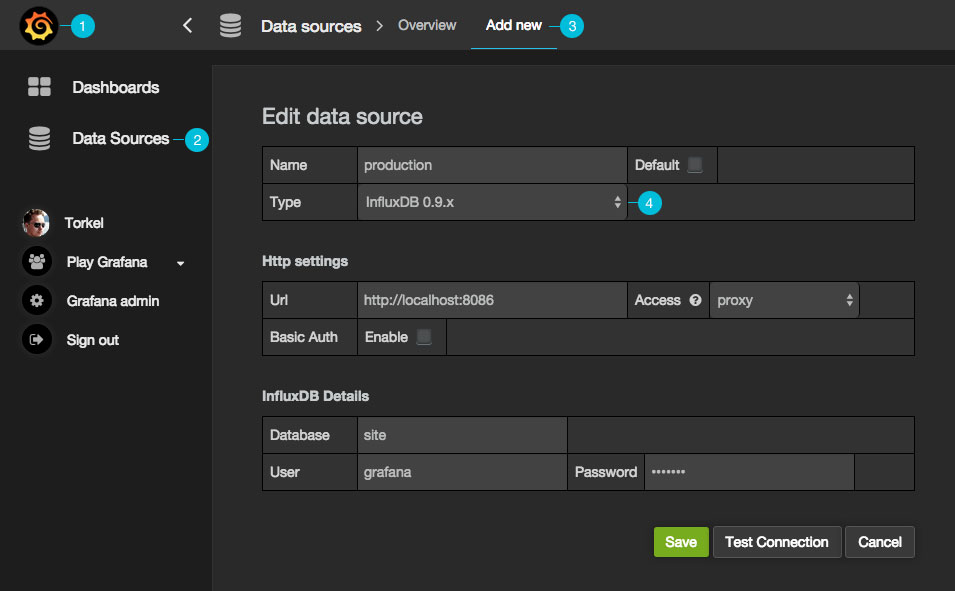
Yeah… no. I understand that the sheer customizability is useful for people with complex infrastructures, but I just want a bunch of graphs of fairly standard metrics like CPU and memory usage, out of the box.
Enter Netdata
After Googling for “simple server monitoring” I came across Netdata.
Netdata is amazing! Compared to Prometheus+Grafana, it is incredibly easy to setup. It requires almost no configuration and gives me a working interface with lots of stats by default. Check out their demo sites.
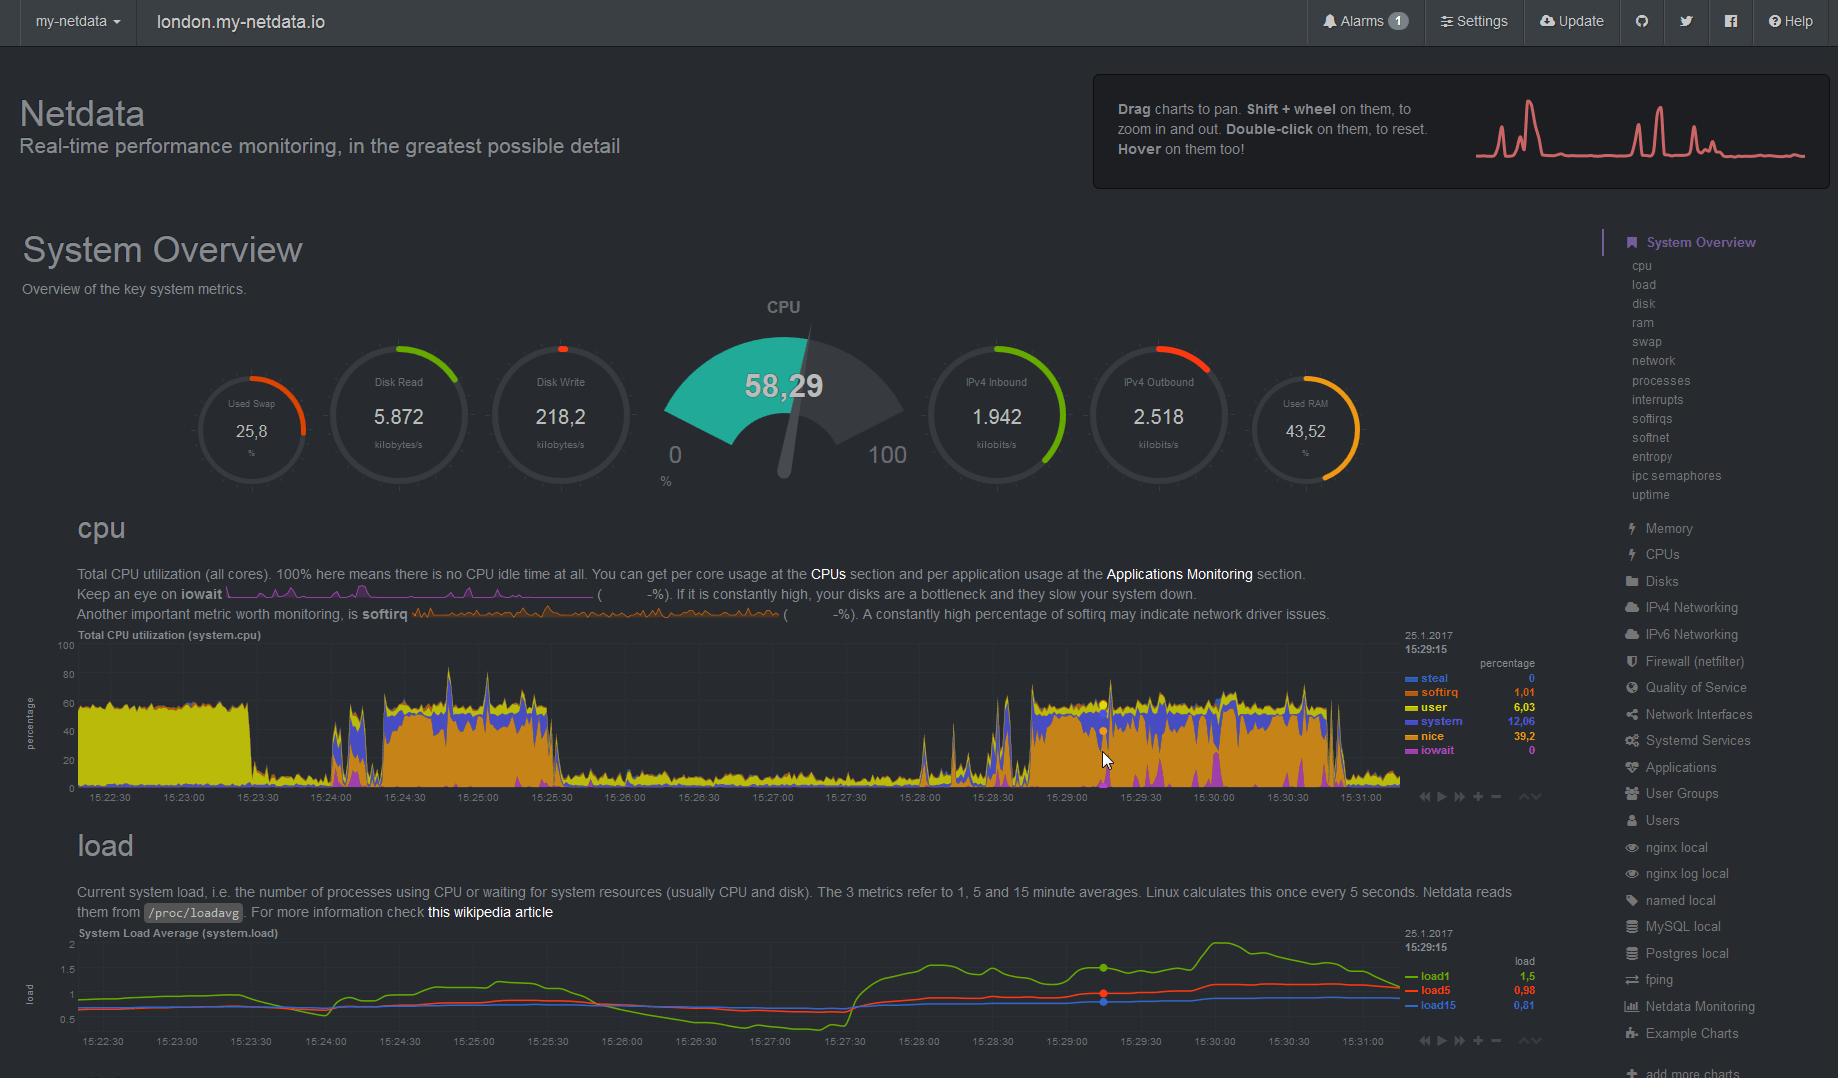
The interface is definitely more modern than Ganglia and Munin. It can be a bit overwhelming at first because there are so many stats by default – almost everything you can imagine that a Linux system exposes via command line tools, /sys or /proc. However, Netdata provides help messages for every stat so that you know what it means.
And unlike the other solutions I’ve checked out, Netdata provides real-time, per-second monitoring. You can see the CPU/memory slider update in real time.
Netdata also provides alerting. It installs a ton of alerts by default.
By default Netdata stores collected stats on the same server. This is very convenient if you are just getting started. It can also be configured to send stats to a central server.
Netdata issues
Netdata’s has three big issues:
- Limited history.
- Unsecured by default.
- No aggregation of stats over multiple servers.
Limited history
Netdata’s focus on real-time, per-second monitoring is also its biggest flaw: it is good for tracking stats of the last few hours only. Netdata’s purpose is to allow you to avoid CLI tools in order to diagnose an outage. But if you want to analyze a historical incident, then Netdata isn’t so good at that.
The reason for this is that Netdata does not support lowering the resolution of older stats data. You can configure Netdata’s history to an arbitrary size, but its resolution will always be per-second. Despite Netdata’s efficient in-memory time series database format, storing per-second data for, say, two months, requires a lot of memory.
Having said this, Netdata can be configured to send its data to Prometheus. It’s not ideal but the option exists.
Security
Netdata’s author claims that the data it exposes, system stats, are not sensitive data. The author also states that Netdata’s dashboard is read-only. Therefore there is no need to disallow access to Netdata’s dashboard by unauthorized parties. I don’t buy this, and I let the author know via Github issues #2043 and #3501.
For one, Netdata contains an embedded HTTP server. HTTP header parsing is a notorious source of security vulnerabilities, and battle-tested servers like Apache, Nginx and Node.js needed many attempts to get it right. Netdata features a custom written HTTP server and parser, yet the author is very confident in its security. The author is a smart guy, but a mistake – especially in C – is easily made. When it comes to security we should err on the side of caution.
And then we have I/O security issues to deal with like Slowloris.
Finally, I am not so confident that system stats cannot be abused. While at first glance I cannot imagine how, the history of side-channel attacks has taught me that many exploits use non-obvious mechanisms. Spectre and Meltdown are the most prominent examples.
There are ways to arrange security yourself. Netdata’s dashboard is plain HTTP, so I put it behind an Nginx reverse proxy with SSL. The Netdata replication mechanism – the mechanism that sends stats to a central server – is not HTTP and so cannot be put behind Nginx. I secured that by proxying it through stunnel.
However there is one final problem. Netdata’s replication mechanism and dashboard live on the same port. That means that a Netdata slave server can access all stats stored on the Netdata master server, via the channel over which it normally sends its own stats data. In order to secure this, I submitted a pull request which implements HTTP basic authentication in the Netdata dashboard. So far the Netdata developers aren’t sure whether this is the right approach; the main author suggested a VPN solution with IP blacklisting as an alternative.
To be continued.
Aggregation of stats over multiple servers
Netdata separates its stats by server. There is no way to – for example – display the CPU usage of multiple servers inside a single graph. This is acceptable if you have a small number of servers but if you want to have a dashboard to monitor 100 servers simultaneously then this is problematic.
Conclusion
Despite all its flaws, Netdata remains the most suitable overall solution for me. Until I my infrastructure grows to be a lot bigger, Netdata will be my go-to solution. Go check it out.