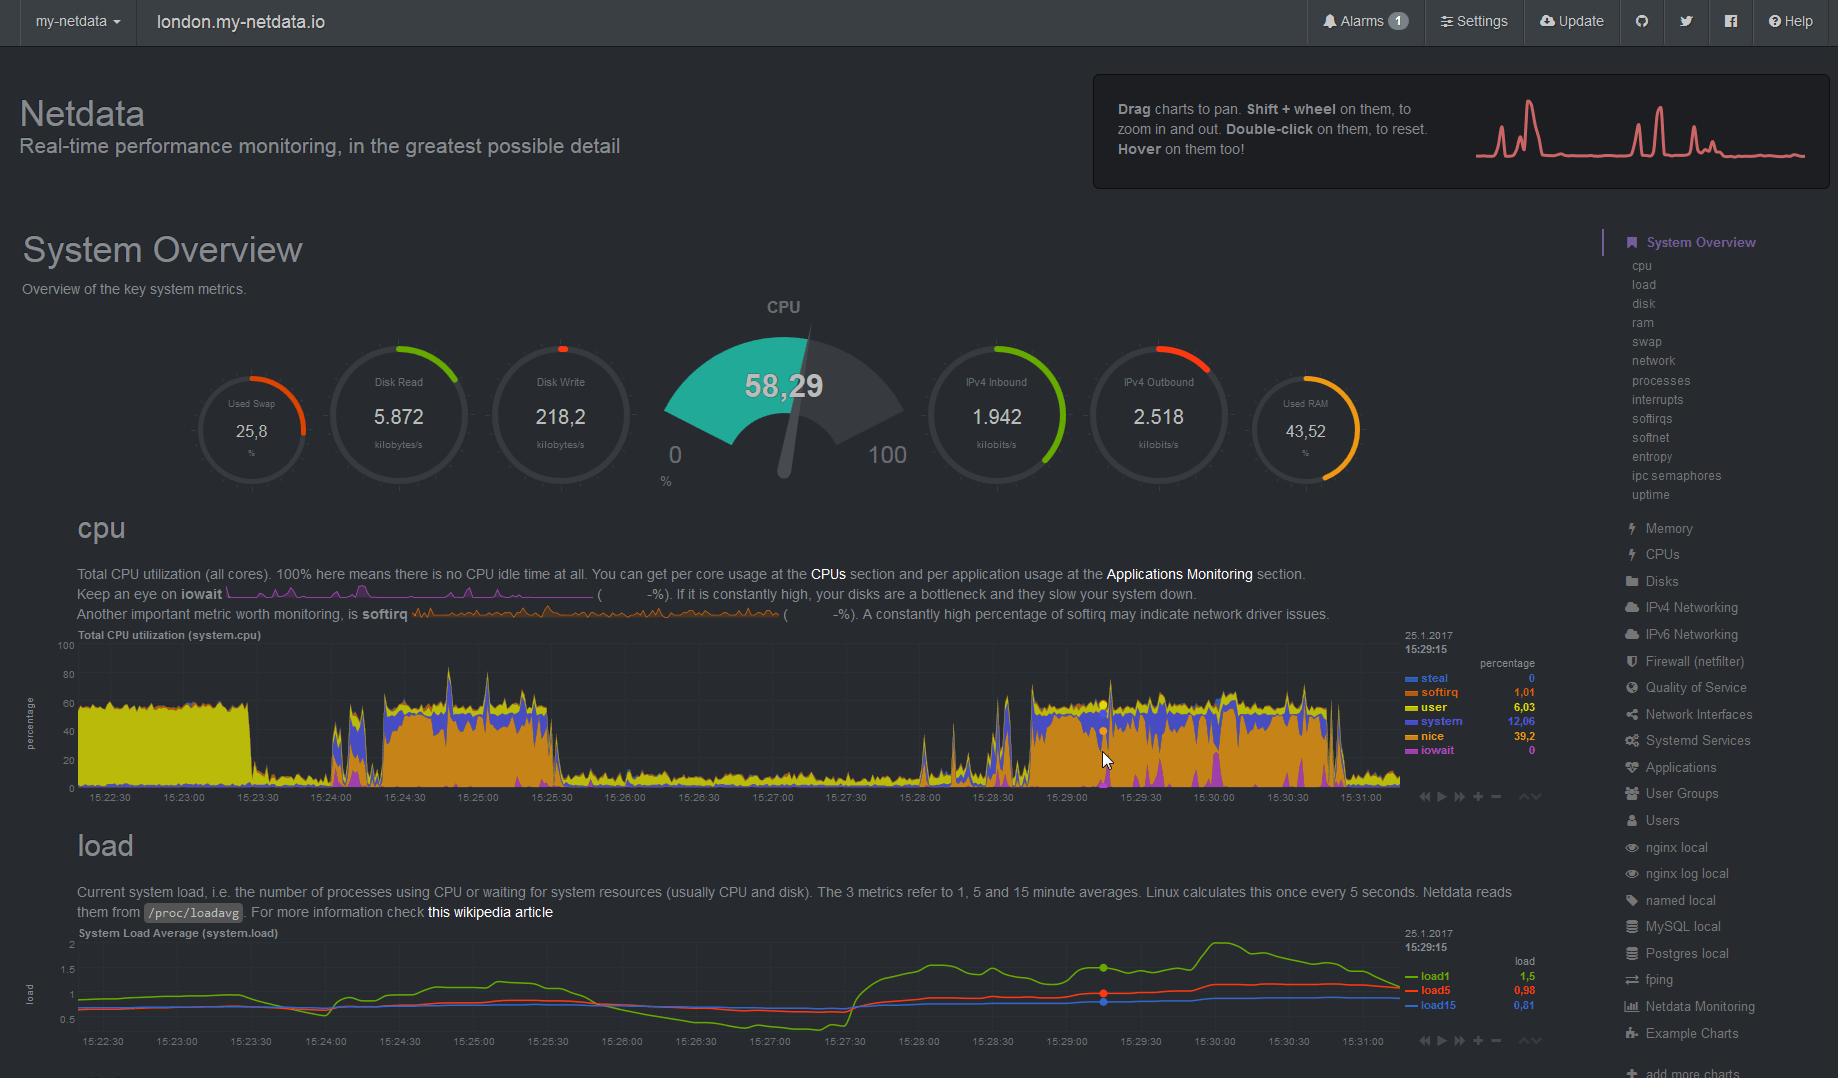
I have been looking for an easy-to-use monitoring solution for Phusion’s servers. One that does not require a lot of setup and that provides a reasonable interface without too much work. Such a solution has to display a bunch of graphs at the very least. (Email) alerting is considered a bonus. The solution also has to be open source, not only because of the cost factor but because I want to own my data. So solutions like New Relic and Datadog are out.
In this blog post I will describe the solutions that I’ve checked out – Ganglia, Monit, Munin, Prometheus, Grafana – and why I didn’t like them. Then I will explain why I think Netdata is a good choice and review its pros and cons.
