Monitoring


In appreciation of Prometheus' engineering

Even though I rejected Prometheus as a choice in my last blog post about Netdata, I actually appreciate Prometheus' engineering quality. From its documentation it is apparent that the authors are very experienced on the subject and have thought through things.

This post reviews some of the things that demonstrate that, namely their responses to the push vs pull debacle, the way they limit Prometheus' scope, the way their alerting system is designed and documented, and the way they treat storage.

Read more »

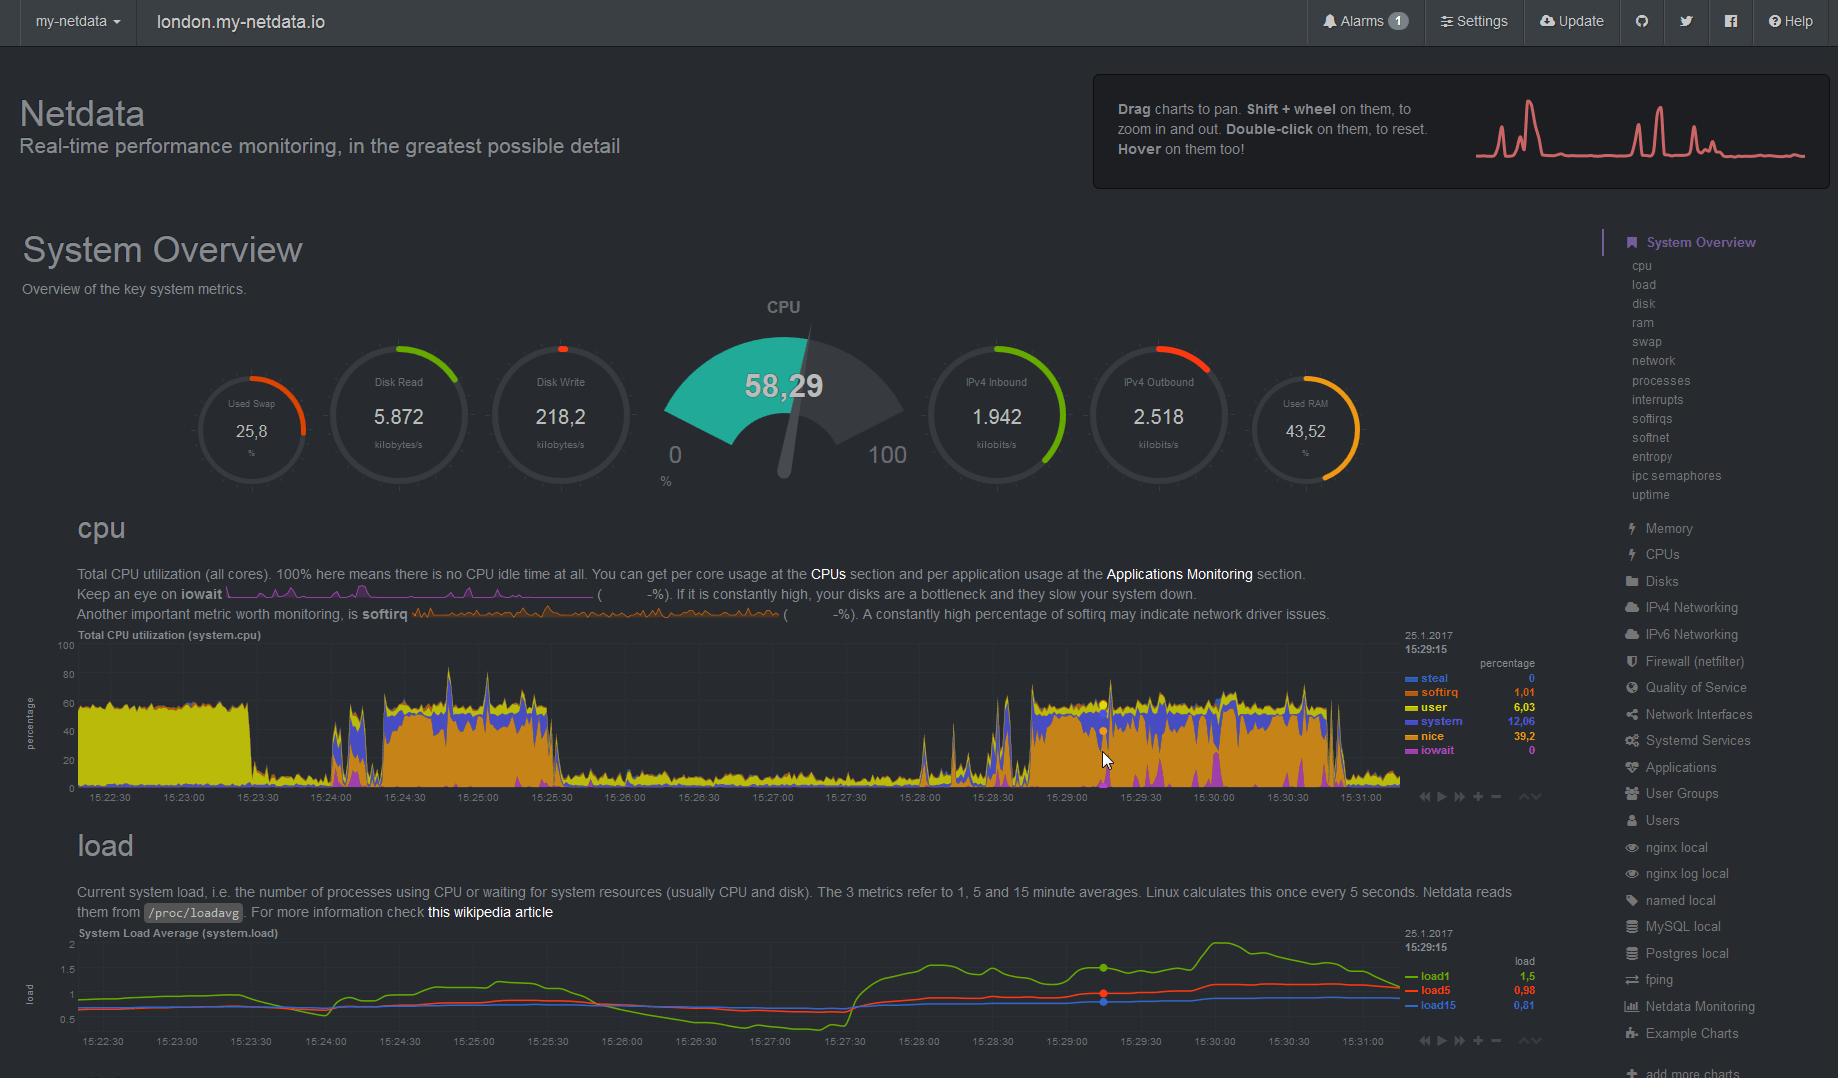
Netdata: simple server monitoring

I have been looking for an easy-to-use monitoring solution for Phusion's servers. One that does not require a lot of setup and that provides a reasonable interface without too much work. Such a solution has to display a bunch of graphs at the very least. (Email) alerting is considered a bonus. The solution also has to be open source, not only because of the cost factor but because I want to own my data. So solutions like New Relic and Datadog are out.

In this blog post I will describe the solutions that I've checked out – Ganglia, Monit, Munin, Prometheus, Grafana – and why I didn't like them. Then I will explain why I think Netdata is a good choice and review its pros and cons.

Read more »